
A restaurant P&L lists sales, then cost of food and drink, then staff, rent and every other cost, ending with net profit. Read each line as a share of sales; that is what makes months and outlets comparable.
The template, with a worked example
| Line | Amount | Share of sales | Usual range |
|---|---|---|---|
| Food sales | 82,000 | 82% | |
| Drinks sales | 18,000 | 18% | |
| Total sales | 100,000 | 100% | |
| Food and drink used | 31,000 | 31% | 28 to 35% |
| Gross profit | 69,000 | 69% | 65 to 72% |
| Staff cost | 30,000 | 30% | 20 to 35% |
| Rent and service charges | 11,000 | 11% | 8 to 15% |
| Electricity, gas and water | 4,000 | 4% | 3 to 6% |
| Delivery platform commission and fees | 4,000 | 4% | Depends on online share |
| Marketing | 2,000 | 2% | 1 to 4% |
| Repairs and maintenance | 1,500 | 1.5% | 1 to 2% |
| Software, card fees and other | 3,500 | 3.5% | 2 to 5% |
| Operating profit | 13,000 | 13% | |
| Loan interest and wear on equipment | 4,000 | 4% | |
| Net profit before tax | 9,000 | 9% | 3 to 15% |
All amounts in your own currency, before sales tax. Usual ranges are rough guides that vary by country and format.
What each section tells you
- Sales, split into food and drinks. The mix matters: drinks usually leave far more per sale.
- Food and drink used. From the stock count, not from purchases alone. Purchases without a count make a busy delivery week look like a bad month.
- Gross profit. What is left after ingredients. If it is falling while prices are flat, portions, waste or supplier prices have moved.
- Operating costs. Staff and rent are the big two. Food plus staff together is your prime cost.
- Net profit. The one line that tells you how well the month was run.
Read it in five minutes
- Look at net profit as a share of sales first. Is it better or worse than last month?
- Find the line that moved most as a share of sales. That is where to look.
- Check food and drink used against what your recipes say it should be.
- Check staff cost against the roster you planned.
- Write down one action for next month, with an owner.
Monthly is too late
A P&L that arrives three weeks after the month ends can only explain a loss, not prevent it. The same lines, updated every day, let you act while the month is still running.
Try it on your own numbers: Prime cost calculator, free and with no sign-up.
See it every day, not every month
Peasily builds the P & L Account for every outlet automatically from sales, stock, purchases, rosters and expenses, and shows net profit first, every morning.
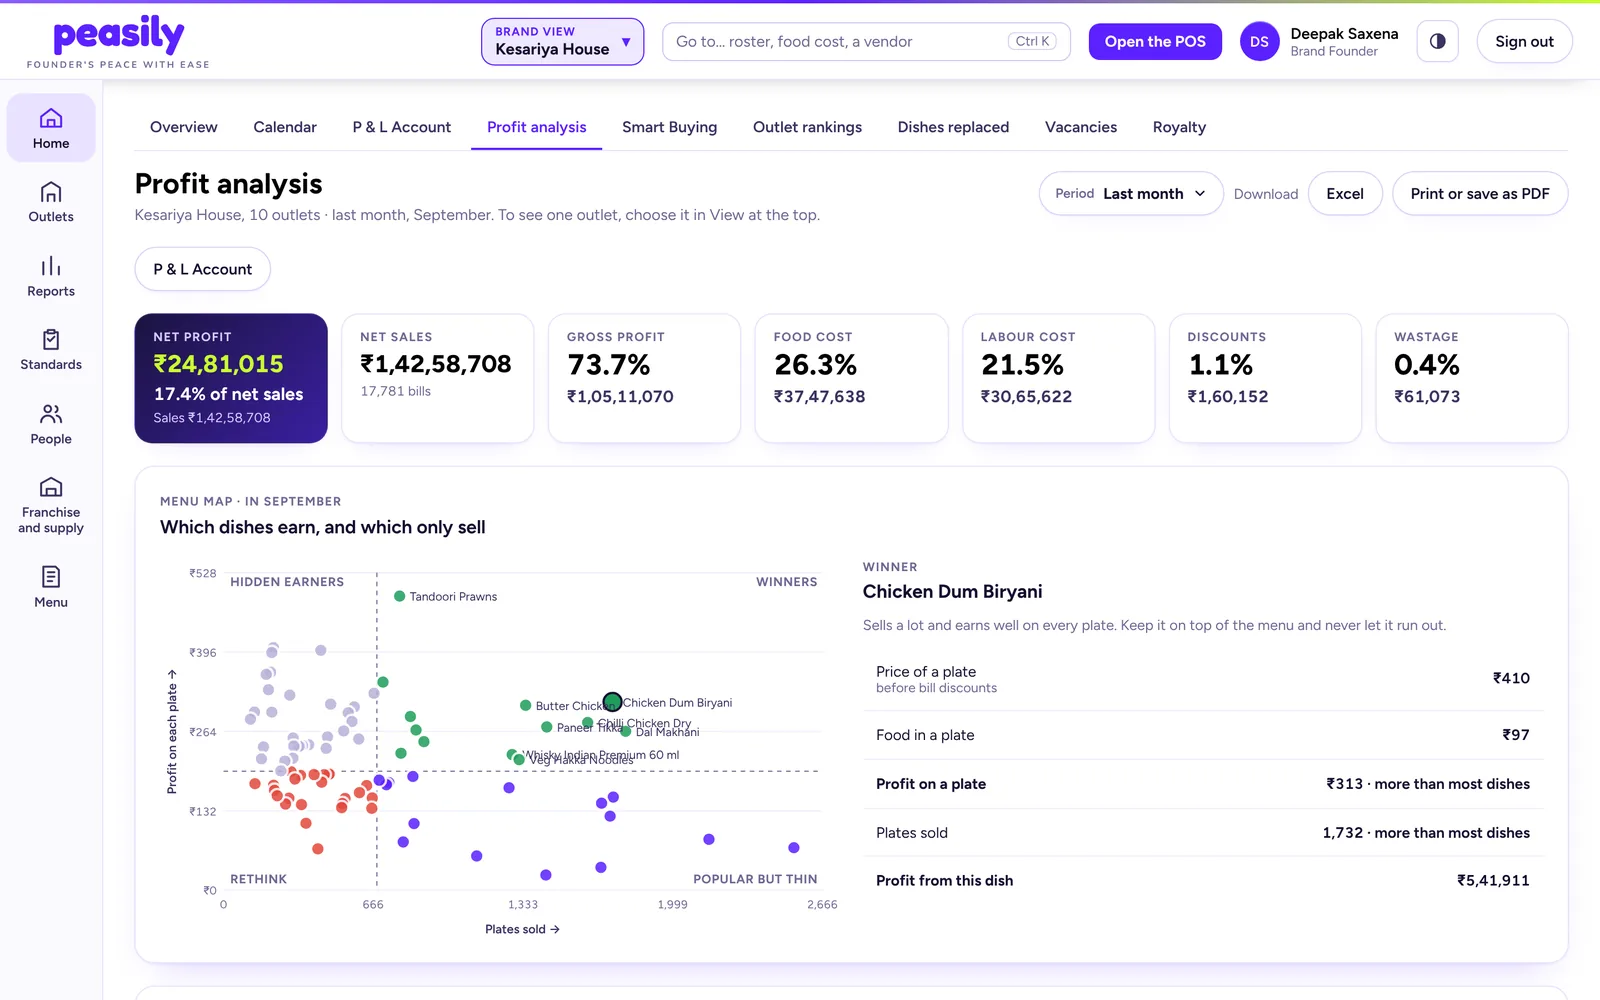
Screens from the Peasily demo brand.
Questions
What should a restaurant P&L include?
Sales split into food and drinks, food and drink used, gross profit, staff cost, rent, utilities, delivery commission, marketing, repairs and other costs, operating profit, loan interest and wear on equipment, and net profit.
What is a good net profit on a restaurant P&L?
Full-service restaurants often keep about 3 to 10% of sales, while quick service and well-run cloud kitchens can reach 10 to 15%.
How often should I look at my P&L?
Monthly at the least, weekly if you can. The most useful lines, food cost and staff cost, can be checked every day.
See your own numbers in Peasily
We'll walk you through it with your real menu and outlets.